Visualizations
Online Data Handler
There is different convenient functionality in the OnlineDataHandler to help developers. Firstly, two visualize functions: visualize and visualize_channels, exemplified in Table 1 are included.
|
|

Figure 1: Raw Data from the OnlineDataHandler
EMG Classifier
The EMG classifier contains a visualization tool for viewing the decisions stream (i.e., the predictions over time) for a particular classifier using the visualize function.

Figure 2: The decision stream of a classifier.
Feature Extractor
The Feature Extrator and Online Data Handler contain a visualization tool for viewing the PCA feature space. This can be done using the visualize_feature_space function. If this function is run on an online data handler, a live PCA feature space will be shown (see Figure 3).
|
|

Figure 3: The PCA feature space of a set of data.
Filtering
The filtering module has a visualize_effect function that demonstrates the effect of a filter on a set of data in the time and frequency domain.
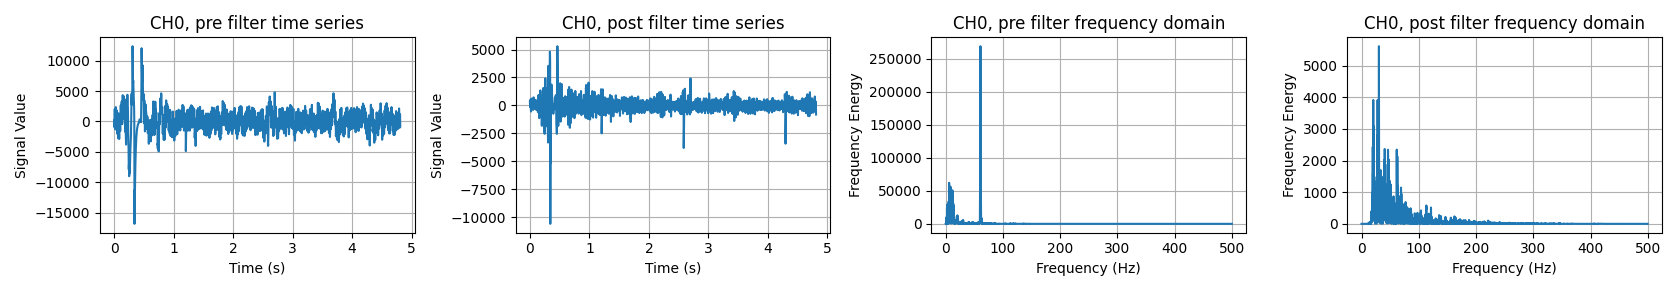
Figure 4: Data before and after filtering in the time and frequency domain.